Quick Guide from AS to AP Macroeconomics
This guide is specifically designed for those who have already learnt AS Level Economics but not AP Macroeconomics.
The Multiplier Effect
MPC & MPS
Marginal Propensity to Consume: The fraction of any additional income that people spend.
Marginal Propensity to Save: The fraction of any additional income that people save.
Because one can only consume or spend their income, .
Multipliers
Government Spending Multiplier: Used when the government directly buys goods and services.
Tax Multiplier: Used when the government changes taxes.
- It is always negative (because a tax cut increases GDP) and it is always exactly 1 less than the spending multiplier in absolute value.
- When the government gives you a tax cut, you save a portion of it before spending the rest, so the initial "injection" into the economy is smaller.
Money Multiplier: Used when the central bank changes interest rate.
Phillips Curve
The Phillips curve is an economic theory stating that inflation and unemployment have a stable, inverse relationship
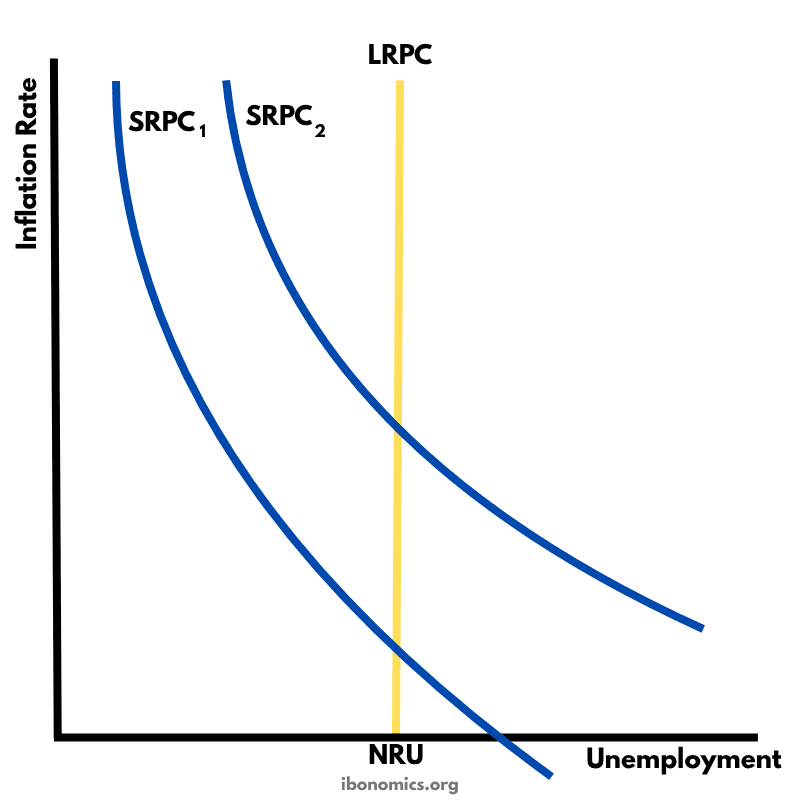
- Short-Run Phillips Curve (SRPC): This is a downward-sloping curve. It shows the short-run trade-off between inflation and unemployment. If you want lower unemployment, you have to accept higher inflation, and vice versa.
- Long-Run Phillips Curve (LRPC): This is a vertical straight line at the "Natural Rate of Unemployment". It shows that in the long run, there is no trade-off between inflation and unemployment.
Shifts in Phillips Curve
- Changes in Aggregate Demand (AD) = Movements ALONG the SRPC.
- If AD increases, the economy booms. Unemployment goes down, but price levels (inflation) go up. On the Phillips Curve graph, this is represented by sliding your dot up and to the left along the existing SRPC.
- Changes in Short-Run Aggregate Supply (SRAS) = Shifts OF the entire SRPC.
- They shift in opposite directions.
- Imagine a negative supply shock (like an oil price spike). In the AD/AS model, SRAS shifts left. This causes stagflation. Because both variables on our axes are increasing, the entire SRPC must shift to the right to show this worse economic reality.
Intersection of SRPC and LRPC
- At the intersection: Actual Inflation = Expected Inflation.
- To the left of the LRPC: The economy is booming (unemployment is lower than the natural rate). Actual inflation is greater than expected inflation.
- To the right of the LRPC: The economy is in a recession. Actual inflation is less than expected inflation.
Analysis instance:
Central bank increasing the money supply.
- Short-Run: The increase in the money supply shifts AD right. On the Phillips Curve, you move up and to the left along the SRPC. Unemployment drops, inflation rises. (You are now off the LRPC).
- The Realization: Workers realize their real wages have fallen because actual inflation is higher than they expected.
- Long-Run Adjustment: Workers negotiate higher nominal wages. This increases costs for businesses, shifting SRAS to the left. On the Phillips graph, the entire SRPC shifts up.
- The Result: The economy settles at a new intersection with the LRPC. Unemployment is back to its natural rate, but the inflation rate is permanently higher.