AP Statistics Problem Collection
1
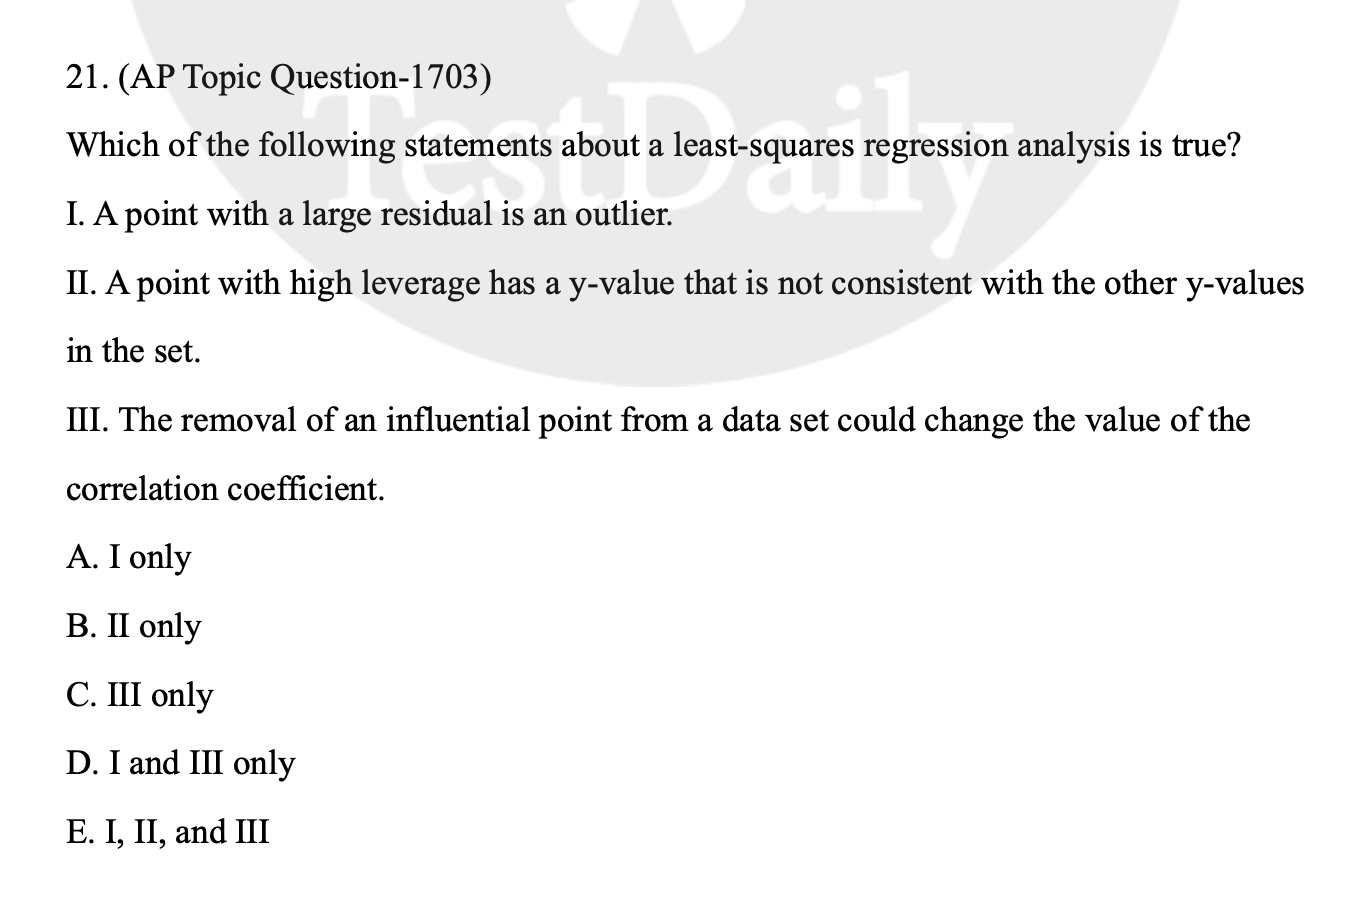
| Wrong Ans | D |
|---|---|
| Correct Ans | C |
| Explain | All of the sample points can have vary large residuals, but they are not outliers as long as they are within the variation of the regression lines. |
2
A researcher is reviewing the output of a two-proportion z-test where : . The resulting 95% confidence interval for is . The researcher is confused because the test statistic yielded a p-value of . Assuming no calculation errors were made, what is the most likely cause of this discrepancy?
- A. The sample sizes were too small to satisfy the Normal condition.
- B. The researcher must have misread the output; it is mathematically impossible for a CI and a test to conflict at equivalent alpha levels.
- C. The hypothesis test uses a pooled standard error, while the confidence interval uses an unpooled standard error.
- D. The confidence interval was one-sided, while the hypothesis test was two-sided.
| Wrong Ans | D |
|---|---|
| Correct Ans | C |
| Explain | Right answer: This is a classic AP Stats quirk. Because assumes , the z-test pools the successes. The confidence interval does not assume equality and uses unpooled data. This slight difference in standard error formulas can occasionally cause borderline results to conflict. Wrong answer: Confidence intervals for proportions are inherently two-sided; a one-sided confidence bound exists but would not be presented in a standard format. |
Pool
To pool data simply means to combine two separate samples together into one giant sample to get a single, overall estimate.
Here is why we do it in a hypothesis test, but not in a confidence interval:
The Hypothesis Test (Assumes they are equal)
When you run a hypothesis test, the golden rule is that you must do the math assuming the Null Hypothesis () is 100% true.
- Your null hypothesis is (the two populations have the exact same success rate).
- If we assume both groups naturally have the exact same success rate, it doesn't make sense to calculate their variability separately.
- Instead, we combine them to get the best possible estimate of that shared success rate. We add all the successes from both groups together, and divide by the combined total sample size. This is called the pooled proportion ( or ), and it is used to calculate the standard error for the test.
The Confidence Interval (Makes no assumptions)
A confidence interval doesn't assume anything. It doesn't assume and are equal—in fact, its entire job is to measure exactly how different they are!
- Because it does not assume they are equal, it has no reason to combine them.
- It calculates the standard error keeping the two sample proportions completely separate (this is called unpooled).
Why this causes the discrepancy:
Because the hypothesis test uses the "pooled" standard error formula, and the confidence interval uses the "unpooled" standard error formula, the final standard error numbers are slightly different.
99% of the time, they will still lead to the same conclusion. But when the results are sitting right on the razor's edge of your significance level (like a p-value of 0.04 against an ), that tiny mathematical difference in the formulas is enough to make the hypothesis test say "Reject " while the confidence interval says "0 is still just barely plausible."